

image: thumbnail.jpg
Dec 15, 2023
|
54 min
|
4.7k views
R Not Only In Production - posit::conf(2023)
Presented by Kara Woo
I will share what our team has learned from successfully integrating R in all areas of our company's operations. InsightRX is a precision medicine company whose goal is to ensure that each patient receives the right drug at the optimal dose. At InsightRX, R is a first-class language that's used for purposes ranging from customer-facing products to internal data infrastructure, new product prototypes, and regulatory reporting. Using R in this way has given us the opportunity to forge fruitful collaborations with other teams in which we can both learn and teach.
Join me as I share how the skills of data science and engineering can complement each other to create better products and greater impact.
Presented at Posit Conference, between Sept 19-20 2023,
Learn more at posit.co/conference.
--------------------------
Talk Track: R Not Only In Production.
Session Code: KEY-1108
I will share what our team has learned from successfully integrating R in all areas of our company's operations. InsightRX is a precision medicine company whose goal is to ensure that each patient receives the right drug at the optimal dose. At InsightRX, R is a first-class language that's used for purposes ranging from customer-facing products to internal data infrastructure, new product prototypes, and regulatory reporting. Using R in this way has given us the opportunity to forge fruitful collaborations with other teams in which we can both learn and teach.
Join me as I share how the skills of data science and engineering can complement each other to create better products and greater impact.
Presented at Posit Conference, between Sept 19-20 2023,
Learn more at posit.co/conference.
--------------------------
Talk Track: R Not Only In Production.
Session Code: KEY-1108
Transcript#
This transcript was generated automatically and may contain errors.
So, I'm very excited to introduce our next keynote speaker, Kara Wu, who's been a long-time friend and a long-time awesome member of the R community.
And again, I have a little poem. Poem, I'll put that in air quotes. I'll introduce you.
Meet Kara Wu, a data scientist pro, from InsightRx, where her coding skills glow. She crafts software with the greatest precision, striving to better medicine's tailored decision. Taming data is her cherished mission. Debugging pipelines a twisted rendition. When tests that chairs, you rock in delight. For her, it's a win, a validation done right.
With R ladies and R OpenSci, she's in the mix. Teaching in workshops, sharing R's fix. Passion for coding, she spreads near and far. Kara Wu, a data maestro, a star.
Thank you for that lovely poem, Hadley.
I am so excited to be here talking to you all at PositConf today. This is the conference that I look forward to all year long, and every year I get so excited seeing all of the amazing projects that everyone is working on. And when we were fully online in 2021, I got so excited that I literally decorated my office with streamers and balloons, just to capture that feeling of excitement that I feel being here.
PositConf feels like the club where everyone is in on the cool things that R can do, and we're all here to hype each other up. And for those of you who are here more for the Python content than for R, now that it is PositConf and not RStudioConf, I'm sure that you will have that experience as well.
When I stroll through these conference sessions and have conversations with all of you in the halls, I almost get this feeling that I'm in this amazing community garden, where all of these projects that people have lovingly tended and cultivated are being shared with the community. And that feeling is really nourishing and meaningful, I think, because when we go back to our day-to-day lives and our jobs, it doesn't always feel that way.
So I'd like to see a show of hands of who has ever felt isolated or siloed in their work. It's a lot of you, and I have too.
When you go back to your day jobs and your workplaces, you may not have colleagues to share a lot of ideas with. You might be self-taught in R or your programming language of choice, like many others here, and you might be struggling to figure things out on your own. Or you might face resistance from people in your organization who say, R can't do that, R's not good for that, R's not a real programming language.
And it can be sort of jarring to go from environments like this conference where you can see all of the amazing things that R can do to being told that, no, it can't.
So I have been there before too. And I have also been the stubborn person at an organization insisting on using R because I knew that I could be productive and build what I needed to build with it. And having come out on the other side of that experience, I can say definitively that I was right.
Not only is it possible to build quality software in R, I think everyone at this conference knows that, it is possible to have an organization where the strengths of R and the people who use R can be brought to bear to influence the entire organization and its mission as a whole.
Not only is it possible to build quality software in R, I think everyone at this conference knows that, it is possible to have an organization where the strengths of R and the people who use R can be brought to bear to influence the entire organization and its mission as a whole.
InsightRX and precision medicine
So I work at a company called InsightRx. And InsightRx, I think, is fairly unique in how pervasive R is to all of what we do. So what I'd like to share with you today are the ways that we are doing this. How we're using R not only in production, but as a first-class language that is essential to fulfilling our mission.
And to illustrate how we're doing that, I'd like to introduce you to Angela. So Angela is a 60-year-old patient with a prosthetic heart valve. And she comes into her doctor's office one day complaining of having fevers kind of off and on over the last week. She's just not been feeling very well.
And her doctor draws some blood samples and sends them off to the lab. But in the meantime, Angela is getting sicker and sicker. And she gets admitted to the hospital, where it turns out that she has contracted an infection called MRSA.
So if you've heard of MRSA before, it has likely been in these kind of like hushed, scary tones. And that is because MRSA is very difficult to treat because it's very resistant to many antibiotics. And so it carries with it this specter of antibiotic-resistant super bug scariness.
But there are antibiotics that can treat MRSA. And one of the ones that is used is called vancomycin. So vancomycin can treat MRSA. But vancomycin is very difficult to prescribe. It's very difficult to get the right dose for a patient.
And that is because with vancomycin, there is a very narrow window between what is enough to treat the infection, but not so much as to cause negative side effects, and particularly kidney damage. So you need to give enough that the infection is treated. But if you go too high, the patient can experience kidney damage. And this is in contrast to some other antibiotics, like let's say an amoxicillin, where you might have a lot more leeway in how much you can prescribe. For vancomycin, that window is very narrow.
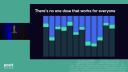
And not only is it very narrow, it's different for every person. When you think about all of the diversity in people who might receive antibiotics, which is most people, there's so much variation in physiological characteristics and all sorts of factors that can affect how that drug is going to behave in a particular person's body. And so there's no one dose that is going to work for everyone. Angela may be represented by one of these bars on this plot, but a dose that works for her is maybe not going to work for me or for you.
So what we do at InsightRx is try to find the exact right dosage of medications like vancomycin for every individual patient. And we do this by combining peer-reviewed, published pharmacological models from the literature, along with the patient's unique characteristics and their data, their lab results, to find the dose that is going to thread that needle and fit right within that window of enough to treat whatever condition they're facing, but not so much as to cause negative side effects.
How R powers the InsightRX platform
And so to do this, we have a web application that can access a lot of the patient's data, either having it directly inputted by their clinician or brought in through their electronic health records. And so we get their height and weight, their lab results, past doses that they've received. And we send all of that data to a REST API that's written in R that can wrangle that data, apply these models, and identify a dose that is going to get that patient to their target level of drug exposure. So the goal level amount of drug in their system to treat the condition that they're facing.
And our REST API that's written in R is going to send that dose, along with various other information and plots and so forth, back to the web application, where it is then displayed to the patient's clinician, and they can use that in combination with their own expert judgment to figure out how best to treat their patients.
So R is core to this product, because the entire point of its existence is to recommend these doses, and R is handling these most important calculations to do that. And so because R is core to the product, that makes R core to fulfilling our mission, which goes beyond treating individual patients, but really towards elevating therapies for all patients.
And so at the next level, we have hospitals who want to understand how their patients are doing as a whole, right? Are all of their patients reaching the targets that they want to achieve? Are they having rates of side effects that are too high? Are there specific subpopulations that are experiencing better or worse outcomes than others? And so we want to help them answer all of these questions, and we can do so using data that comes from our NOVA application, the one that I just described.
So we have an ETL pipeline that extracts data from the NOVA database. It de-identifies it, transforms it, and wrangles it in various ways, and loads it into our data warehouse. And once it's in our data warehouse, we've then developed a second R pipeline that pulls in the latest data, batch processes it to calculate these metrics that the hospitals are interested in, and loads it back into the data warehouse. So we've written a custom R package that can find the latest data, calculate all the things that we need to calculate, and save it back to the database, where it is then shown through dashboards and reports to the hospitals inside our Apollo product.
So we have NOVA, we have Apollo, and then once we have this batch-processed data in our data warehouse, we can actually use it to refine the models that power NOVA. I mentioned that these models are published and peer-reviewed models from the literature. Well, in our data warehouse, we have access to, in many cases, larger and more diverse data sets than the original study authors had access to. And so we can, in certain cases, refine and retrain some of these models, develop new models, and create other research that we feed back into the research community, as well as bringing it back into the platform. And this is maybe our most traditional use of R, right? Because it's doing analyses, creating figures for publications, writing reports, but it's no less crucial to the functioning of what we do.
So R is a part of this entire process of treating individual patients and improving, then, care for all patients. We have our REST API that's powering NOVA. We have our data processing pipeline. We have our analyses and new models. And we use R for many other things besides. So I'll give just a couple more brief examples to give you a sense of the breadth of the ways that we're using R.
We validate all of our models using R. So we have implemented these models from the literature in R, and we need to make sure that our implementations match what was originally published. And so we've developed an R package that can take outputs from our models and compare it to a gold standard in pharmacometric software and make sure that those outputs all line up.
For regulatory reporting purposes, we need to verify that our software behaves the way that we say that it does. Not just the models, but the software as a whole. And so we have another R package that can automate some of that process.
And then we use R, and particularly Shiny, for new product prototypes. So within the data science team, we have both a lot of domain expertise as well as the coding ability to be able to create product prototypes for new ideas that we want to explore. And we can very rapidly develop these prototypes, much more so than if we were going back and forth between one team with the domain knowledge and one team with the coding expertise.
And there are many more options, but I will rein myself in at that point. But suffice it to say that R is crucial to all of what we are doing.
R as a first-class language
But I don't think it's a surprise to people here that R can do all of these things individually. We know that you can create REST APIs really easily with Plumber. We know that R is great for writing analyses and creating reports in R Markdown or Quarto. And we definitely know that Shiny makes it incredibly easy to create awesome interactive web applications.
What is different here is the attitude of R as a first-class language and the idea that if we have a new problem, we can and are willing to solve it in R just as easily as we might in any other language. And I think that that mindset requires us to approach our work in a fundamentally collaborative way because all of our systems that I showed in that graph have components that are written in R and written in other languages that need to work together.
So when we're developing a new feature, there might be business logic in our R API as well as UI changes that are needed to support that feature. And so in order to make all of this work, we have to work very closely. We're following the same release cycles, the same sprint cycles, and adopting many shared practices so that all of our pieces of this system work together in concert.
And so as a result, because our work is so tied together, when we have a new problem, we can be pretty open-minded about who solves that problem and how we solve it. And I think that that leads to better solutions overall. And so I'll give an example.
Our Nova application is used in multiple different countries in the U.S. as well as in Europe. And so it needs to operate in multiple different languages. And the way that we manage this, which is the way that many web applications do, is through localization files. So localization files list out all of the pieces of text that might appear on a page.
And when the app is running in the U.S., it goes into the English version of the file and pulls out the text that it needs to display and puts it on the page. So at the Change My Password button, it's going to extract that text and put it onto the page. And if the app is running in a German-speaking country, then it will go to the German version of the file and pull out that text and display it on the page.
these files are professionally reviewed by fluent speakers, humans. But in between releases, we need a way to keep all of these localization files up to date.
And the way that we used to do this was that anytime an engineer made a change that affected some text, they would edit the English version of the file, and then they'd copy their new text into Google Translate and translate it into all these different languages, and then copy and paste it back into the other language files.
And this was very cumbersome and tedious, particularly if you're changing ten or more labels, right? You have to translate all of these into multiple languages.
And so my colleague and I decided that we could write an R package that could make this easier.
So our R package will look at the English version of the file and detect lines that have changed, text that has changed. And it's going to send each of those updated labels to a translation API to translate it into the multiple languages.
And then it can go to the corresponding locale files and insert that text exactly in the right location where it needs to be.
And so now an engineer doesn't need to manually run all these translations. They can edit the English version of the file and have the rest of the translations automatically generated for them.
And again, before release, these are all reviewed. But this speeds up the development process considerably and really reduces friction.
And I think that this story illustrates how R can be brought in to solve problems that don't have that much to do with data science, right? Because these are localization files for a web application that is not primarily written in R. It's not primarily developed by data scientists. But we saw this problem and this point of friction and because we had this mindset, we realized that there was no reason that we couldn't use R to solve it. And in fact, we solved it very quickly and easily using R.
R as a first-class language
So our mindset of R as a first-class language empowers us to solve problems. We felt empowered to solve this problem even though it wasn't primarily a data science problem because we know that R is a first-class language at InsightRX.
And sometimes the problems that we're solving may be relatively straightforward things, like making it easier to work with localization files. But they can also be bigger things that really affect patient care for patients like Angela.
Angela's case: detecting acute kidney injury
So let's check back in with Angela. Angela is in the hospital. She's receiving vancomycin to treat her MRSA infection. And as I mentioned, with MRSA and with vancomycin, if the dose is too high, it can cause damage to the patient's kidneys.
And so her doctors are regularly collecting lab results to make sure that Angela's kidneys are functioning correctly, healthily. And we're using those lab results in our calculations to determine what dose to recommend for Angela.
But we realized that wouldn't it be nice if we could actually alert the clinicians in the event that Angela's kidneys are starting to show signs of acute kidney injury. So we have this lab data in the web application, and we could raise some warning in the UI to let the clinician know, hey, you know, there may be a problem here. Maybe they need to adjust treatment or take some action.
So because we have this mindset of R as a first-class language, we know that we can do this in R. So we start with this idea for this new feature and the mindset that we can build it in R. And then maybe we write some code to detect acute kidney injury and get something that works on our machine.
But then to go from that to an actual feature and a final product takes a little bit more work. And how do we get from something that works on our machine to that final product?
We have had to invest in certain practices in that space between the prototype and the final product to make sure that our work is reliable and deployable. So the reliability is important for many reasons, the most obvious of which being that there are real human patients whose health is directly affected by what we're doing. And the deployability is important because we need a way to make sure that our code and everything that it needs to run can get to wherever it's going to run.
And even for software that's not going to run in its own standalone way, but rather things like reports that we generate, it's beneficial to us to have a reproducible pipeline to create those so that we're not subject to the unique setup of one person's laptop.
Ensuring reliability with testing
So when we're thinking about reliability and how to detect kidney injury reliably, we need to make sure that we're detecting it accurately all of the time. And the way to detect acute kidney injury, or AKI, is relatively straightforward. So in everyone's blood, there's a waste product called creatinine.
And a healthy, functioning kidney is going to filter out creatinine over time. So ideally, my body's producing creatinine, my kidneys are filtering it out, and that level is staying relatively stable in my blood. But if my kidneys are not functioning well, then the level of creatinine is going to build up and build up in my blood. And so if that level goes up by a certain amount within a certain period of time, then that constitutes an acute kidney injury.
And so if this were a graph of someone's creatinine measurements, they start to go up, and by the time you reach the dot with a one on it, the yellow dot, that's a stage one acute kidney injury, and then there's additional grades of severity beyond that.
So elevated creatinine suggests kidney damage. This is relatively easy to calculate in theory, but in reality, things always get messy. You might have gaps in your data so that you can't really tell how quickly creatinine is changing.
You might have data that comes in out of order that you need to sort before you can calculate. You might have data that's reported in different units that are totally different and need to be standardized. You might be missing the baseline creatinine values for a given patient. So you know what their creatinine is now, but if you don't know where they started, then how can you tell how much that's gone up?
You might have data that's not numeric. I think anyone who has worked with real-world data has experienced the phenomenon of data that really ought to be numbers coming in with other characters that you have to strip out before you can handle it appropriately. And there might be data entry errors, either from the electronic health record system or from manually inputting data.
And so when we're trying to build a reliable feature, we need to be able to handle all of these scenarios, both now and in the future as our code changes. And to do that, we add tests.
So this is a test using the testthat package, which is in my top five most indispensable R packages that I cannot live without. And in our test, we're going to lay out the scenario that we want to capture to make sure that our code behaves the way that we expect. So this is a test where we say that we're testing that AKI stage is calculated correctly, and we're going to run our AKI stage calculation function with some sample data that we expect should produce a particular result. In this case, it's a stage one acute kidney injury. And so then in the last line of the test, we'll explicitly state that we expect that the result of our function is going to equal a stage one kidney injury. And if it doesn't, this test is going to fail.
So we write these tests for all sorts of scenarios that we want to capture, right? Different stages of AKIs, no AKIs, data that looks, you know, in different ways, as well as scenarios that we don't expect to encounter or hope we don't encounter, but would need to handle gracefully nonetheless, like out-of-order data, non-numeric inputs, missing observations.
And once we have this collection of tests, we are sort of getting at all of our code from many different angles to make sure that it is reliable and it's functioning correctly as long as we are running the tests regularly, right? Because if we're changing our code and not rerunning the test, then maybe we've changed some behavior and we have no idea. So we need to run these tests often.
And if I am disciplined, I can do that ten times a day. But I'm busy. Sometimes I'm lazy. I have other things that I would like to do with my life other than run these tests all the time. And the reality is that if we're relying on me to run the tests, they're not going to run often enough.
Jenny Bryan once said that if you use software that lacks automated tests, you are the tests. Well, if we build software that lacks automated tests, then that means our users are the tests. And by extension, they're patients. And so that is not acceptable at all. And this is where continuous integration comes in for us.
Jenny Bryan once said that if you use software that lacks automated tests, you are the tests. Well, if we build software that lacks automated tests, then that means our users are the tests. And by extension, they're patients.
Continuous integration
Continuous integration allows us to automatically run these tests so that we are constantly making sure that our code is behaving as intended. So every time we push new code to GitHub, we kick off a pipeline that gets that latest code, it builds the R package that it contains, and it runs the tests. And then it's going to send its results back to GitHub in a way that we can clearly see.
So if we were to look at the git history of our project, we might see something like this. We have a commit where we add our function to detect AKIs, and we write our tests along with that so all of those tests are passing. And we get this nice green checkmark, which is very satisfying to me.
And then maybe we realize that the performance of our function is lacking. We need to refactor it in some way to make it faster. And so we rewrite it, and we think that we've preserved its previous behavior, but actually we have changed how it handles some edge case like how it deals with missing data. And so tests that used to pass start to fail. And our continuous integration pipeline is going to send this angry red X back to GitHub, which I find incredibly unsettling and impossible to ignore.
So because I'm alerted in this way that is very, like, pings me right in the brain, I can go in and fix the way we're handling missing data in our function so that the tests pass again and I get my nice green checkmark back.
So continuous integration allows us to find bugs quickly because it's running automatically as soon as we make changes to the code. It lets us free up time for more important work, and it makes sure that our code continues to behave as we intended.
So testing and continuous integration together are two of the practices that are most important for us to ensure the reliability of our work.
Deployability with Docker
And then when it comes to deployability, we need a way to take our code and all of the things it needs to run and get it to some place where it can run off of our laptops. And there are many different ways to do this. If you have access to Posit Connect, that can make it super easy. In our case, we use Docker heavily to be able to deploy our applications.
So Docker allows you to package up your code and everything it needs to run into a self-contained little bundle called an image. So R itself, any R packages you need, your code, any files your code needs, all get wrapped up into this nice little bundle that can then be sent off to wherever it needs to run.
And we define these Docker images using a Dockerfile, and so I'll give a brief example of how this might look.
In our first line of our Dockerfile, we're going to say that we're going to start with an existing Docker image that already comes with R and Plumber installed. The RStudio Plumber, the 1.1.0 image, comes with R and Plumber. And let's say we're building a Docker image that's going to run a Plumber API, so we need that package installed. So we're going to take this existing image, and then we're going to add to it whatever else we need. So maybe we'll add another package, like this open source package called clinpk that we maintain.
And after we install our packages, we're going to copy over our source code from our project into the Docker image. So that's what this copy line is doing. It's copying over our code, and then we're going to set our working directory to where we've copied that code, so we have all of our files nicely around us. And then in the last line of this Dockerfile, we say that when we start up a Docker container based on this image, we're going to source this entrypoint.r file, which is going to run our Plumber API.
I've put this example and a couple of others up on GitHub, so if you feel like playing around with a couple of relatively simple Docker images, Dockerfiles, you can check those out. But the important thing about this is that someone could build and run this Docker image without ever installing R on their machine. You don't need to have R. You don't need to have Plumber. You can build all of this and run this project without installing R yourself on your machine.
And so that makes Docker a really useful interface between our data science team and other teams because they don't need to know anything about R to be able to build an R project, and I don't need to know all of the tools and background software for other languages to be able to run those projects. And so when it comes to deploying our application, I go to our DevOps engineer who maintains our Kubernetes cluster, and I don't know anything about maintaining a Kubernetes cluster, and he doesn't need to know about what it takes to run an R project. If I can share this working Docker image, then that can be that point of connection and collaboration for us, and that has worked really quite well for us.
Docker is also actually an important component of how we maintain the reliability of our code as well. So I mentioned that our continuous integration pipeline gets the latest code, builds the R package, and runs the tests. But what it's actually doing is building the Docker image that contains the R package and running the tests in there.
And this distinction is important because the Docker image that it builds is the exact one that we are going to run in production. It's exactly the same. And so we can eliminate any errors due to package version mismatches or subtle things that are different in one environment compared to another. We are testing the exact versions of everything that's going to be deployed in production, and that gives us greater confidence in that reliability.
So we've built our feature. We've tested it. Those tests are running automatically. Now we have our Docker image that contains our feature, and when it comes time to deploy the final product, we'll go to wherever we're hosting it and swap out the previous version of our Docker image with the new one that we've created. And that gets us to the final product.
So we started with this idea that we could build this feature and build it in R. We wrote it. We adopted these practices to make sure that it was reliable and deployable. And now not only Angela, but all patients can be monitored on an ongoing basis and their medical teams alerted if they are experiencing acute kidney injury.
Bringing data science skills to the broader organization
So I've shared some of the more technical aspects of how we make our work in production for us. And I am aware that it might seem like a little bit of a lot. But for us, these practices are crucial to make sure that we can run our in production and have it be a functioning, first-class system within our organization.
And adopting these practices also gives us as data scientists on our team a greater connection to the rest of the organization because we are all following a shared set of practices and working together in a common way. And so we can bring our own skills and practices that are useful to us as data scientists to that equation as well.
It's not just in the dashboards that we create, the visualizations and the reports that we build that we bring value to our organizations. We as data scientists can bring our skills to the craft and the process of building software as well. And that is something that I think a lot of other people in our organizations can learn a lot from.
So what are these skills and practices and mentalities? The first one is that we as data scientists are motivated to answer questions. I think that this is something that unites most data scientists. And it's something that we can apply to our programming conundrums just as much as to modeling customer churn or whatever it is that we're doing.
Debugging your code is essentially an exercise in testing a hypothesis where you observe some phenomenon where code that you have written is not behaving the way you intended or is showing some undesirable behavior. And you need to develop some kind of hypothesis about why that is the case, gather some data that you can use in some way to analyze and test that hypothesis, and maybe conduct some experiment.
So I'll give an example of a time where we did exactly that. In one of our applications that the engineering team maintains, we had a database query that was too slow. It was taking too long to return data to a plot. Customers were complaining. And so the idea was to add an index to the database to improve the performance of this query.
So we added this index. And then the next day, our batch processing pipeline that uses R to calculate all these metrics that we show to our hospitals in our Apollo product, that data processing pipeline was too slow to run. And it was assumed that because we had added this index, that was slowing down the pipeline. And in theory, this is a plausible explanation because when you add an index to a table, typically it can make it faster to read data, but it can make it slower to write data to that table.
So we rolled back the change. We removed the index. And the next day, our processing pipeline was fast again. But the day after that, it was kind of slow again. So weird. I don't know. Whatever.
A few months later, we had another issue of a database query in a different part of the app that was too slow. And again, someone proposed adding an index to the database. But this time, the engineer who had to roll back that change last time said, well, last time it slowed down this other thing. I don't think that we can add an index here.
So now we're stuck in a situation where our users are suffering slow queries, but we are wary of making any changes that would improve them. And I was not very happy with this scenario because I feel like whenever you're in a situation where you can't make changes because you're afraid of breaking something, that thing is already incredibly broken. And we, between our two teams, have control over this whole system, so there's no reason that we couldn't actually figure out whether the index was the cause of the slowness or not. No one had actually confirmed that. They just rolled back the change.
that thing is already incredibly broken.
So together with a colleague of mine, we ran a little experiment. We have a staging database where we can test out changes before we make them to production. So on that staging database, I ran our data processing pipeline, and I timed it. And then we added the indexes that we wanted to add. And then I ran that same pipeline again and timed it again. And I think that they were within milliseconds of each other. There was absolutely no difference in how long it took to run this pipeline with and without the indexes. And so there was no reason that we couldn't add those indexes.
So I share this story because I think it illustrates a time when we could bring a data science mindset and an experimental approach to solving an engineering problem that would have been really difficult to answer without some controlled experimentation.
Visualizing and communicating findings
The next skill that we as data scientists, I think, bring to the process of building software and the work that we do as a company is our ability to visualize and communicate our findings. A simple plot really does speak a thousand words. And I think that for a lot of people who have been in data science for a while, it's almost second nature, and you can almost take for granted, right, the ability to throw some data into a plot just to answer a quick question. But it's really an empowering skill.
There's all kinds of tools out there for observability and monitoring the health of software applications that will show you all kinds of different charts and graphs and whatever. But when you have your own data and just want to see how it looks, nothing beats the ability to do that really quickly on your own without having to feed it into some external tool.
So another example. Our DevOps engineer came to me and asked if we could compare two different ways of hosting our R API. So we had it in one hosting environment in AWS, and because it's AWS, there's like a million other options that you could consider to run the same thing. And so we wanted to consider another one that could also have hosted our API but had different technical limitations and tradeoffs, cost differences, and potentially performance differences, which was what we wanted to look at.
So again, approaching this like a data scientist, I ran another little experiment. And remember I talked about the importance of adding tests. Well, in our code base, we have hundreds of examples of API calls that we use in our tests to make sure that our code is returning the results that we expect. And those tests then became the data that we used for this experiment because when we are comparing two versions of the API, we need some realistic test data that we can send to those to time how long it takes to return an answer. And so all of these test cases became the data that I used, and I sent them both to our two versions of the API, and I timed how long it took to run each of them.
And I plotted the results. So on this plot, the x-axis is our existing hosting environment and how long it took to run each API call against that environment. So each of these dots is one API call. And on the y-axis, we have the second option that we were comparing it to and how long it took to run against there. And you can see, based on the fact that almost all of these points fall below that one-to-one line, that option two was performing much faster than option one or consistently faster.
Now, to actually determine which one we were going to go with of these two options, there's a lot more to dig into. There's performance under load. There's configuration tweaks that we could make to either option to potentially improve things. There's the cost differences to consider. But the quick answer to is option two worth pursuing, this was immediate yes. And it took very, very little time and effort to create a plot that just quickly captured that this was something that we should pursue. So again, we're bringing a data science skill to an engineering decision or, in this case, a DevOps decision in a way that really helps us move forward quickly.
Dealing with uncertainty
And then lastly, data scientists are used to dealing with uncertainty. There is uncertainty inherent in all of what we do. And I don't just mean statistical uncertainty, although that is part of it as well.
I don't know if any of you remember this website called Twitter. But my colleague once tweeted there that an underappreciated struggle in data science is trying to not sarcastically answer how many users did we have last month with, that depends on what you mean by have users and last month. Again, I think this is relatable to many of you, that this struggle to define the terms that we're even talking about is a crucial part of data science. I mean, it might be like 80% of data science.
So data scientists are used to digging into the weeds of this uncertainty. And when we are debugging code, it can really be like debugging on hard mode because the types of issues that we run into, in many cases, are different than in more traditional software. A bug in a machine learning model may not translate to an obvious error. It might just degrade the accuracy of the model. So how do you even know if a bug is there? It takes a lot of skill and dedication to uncover these types of issues. And that is work that data scientists are used to putting in because the nature of our work is very uncertain.
So I think that this leads us to kind of pull at threads when we're solving a problem that other people might not consider and allows us to bring a lot of creativity to solving those problems.
So I think all of these things, our motivation to answer questions, our skill at visualizing and communicating results, and our ability to handle uncertainty are all really important and useful skills that we bring as data scientists to our organizations, wherever they may be. And they're things that other people can learn a lot from, too.
So I think all of these things, our motivation to answer questions, our skill at visualizing and communicating results, and our ability to handle uncertainty are all really important and useful skills that we bring as data scientists to our organizations, wherever they may be.
So I hope at this point that I have convinced you that using R in this way is working for us. It's not always easy. Sometimes it requires us to go outside of our comfort zones, pick up some new skills. But in my opinion, the benefits really outweigh the challenges. Because by using R throughout our software stack, we're enabling ourselves to do science throughout our software stack. And that is true both in what we build and in how we build it.
So in the products that we build, we are taking advantage of R's strengths to provide the best therapies possible for patients. And in how we build it, in the process of how we're working, we're taking on new practices that improve our own work, making it more reliable and robust. And we're sharing our unique skills as data scientists with others in the organization.
So for those of you who raised your hand when I asked if you had ever felt isolated or siloed in your work, or if you're just looking for ways to take the things that you're learning about here at this conference back with you, I hope that I have planted a seed, that it is possible to do this. It is possible to bring the bountiful ideas that you are picking up at this conference and share them with your organizations. And I hope that you will.
Q&A
Thanks, Kara. So hopefully you remembered. If you want to ask questions, ask them on Slido. While those pour in, I have a question for you, Kara. And that is, you talked a lot about using R at work. Yeah. Do you have a fun example of, like, using R outside of work at home to solve some kind of challenge?
Yeah, I use R outside of work at home all the time. For a while, I haven't done this recently, but for a while I was tracking my car's gas mileage with a Shiny app. Because I, like, I noticed when I was, like, filling my car up at the gas station that it seemed like I wasn't, like, getting as much mileage out of a tank. And so I would, standing at the gas station while I was pumping gas, like, put data in a Google sheet, and then I wrote this Shiny app to visualize how my gas mileage changed over time. I do household budgeting in R. I feel like there's other examples, but yeah. I use R all the time.
Okay. Hopefully Jenny Bryan is helping me out
filtering the Slido questions. So hopefully she is about to paste one in here.
Well, it happens. Also, yeah, I use R a lot at home as well. And we use it, like, surprisingly a lot for this conference. Like, a lot of the information ends up in a Google sheet which we can collaboratively edit. And we have, like, an R Markdown script, a Quarto script that, like, pulls it and displays it in various ways. It's, like, such a great, that combination of, like, Google sheets for data entry and R for, like, exploring is, like, such a powerful combo. Yeah.
It's very empowering just to, like, be able to do that.
Q&A: Test coverage and stakeholder communication
Okay. Jenny is typing into Slack.
While CICD helps maintain consistency, how do you think about test coverage? And how do you think about, like, when behavior changes or models update to the actual stakeholders?
Sorry. Can you say the last part of that again? How do you update stakeholders when things change, whether it's, like, model updates or changes to behavior?
Yeah, that's a great question. So in terms of test coverage, I mean, there's a variety of automated tools that can tell you exactly how much test coverage you have. And so those can be really useful. But I think that for us, a lot of it comes down to the social expectations and just amongst our team reinforcing that when we're adding new code, that we're testing all aspects of that. And so, like, I'm being, like, kind of pushy in my code reviews to make sure that we are, you know, testing things as we're adding them and testing multiple different scenarios. So I think that there's, like, a big social component to that process.
But I think that for us, a lot of it comes down to the social expectations and just amongst our team reinforcing that when we're adding new code, that we're testing all aspects of that.
And then when it comes to updating behavior, again, I think with how we work, because we're in the same sprint cycles, we kind of have a lot of visibility across stakeholders as to what new features are coming, what changes in behavior are coming. And in many cases, those also have to be communicated to the customers as well. And so when we, you know, develop a new feature, we on the data science team develop a new feature that turns into a feature in the application, we might write up some, you know, one-page explanation of what this is, what it means, you know, how to interpret it, that we work together with our customer success folks to turn into something that can be user-facing as well. So there's a lot of kind of translating and communicating in written form as well.
Learning new skills and tools
What about learning skills that are kind of traditionally outside the wheelhouse of a data scientist? Like, how do you go about learning Docker and other tools like that?
Great question. I, in my experience, I peek at a lot of other packages. So I have various people on GitHub who I know write good software or write interesting tools, and I want to see how they do it. And so a lot of what I learn I sort of take from examples, and that's why I put that Docker example up on GitHub so that there is something existing that is relatively simple that people can play around with if they want. So seeking out examples, especially from other programmers that you admire, I think is a great way to learn. And some of it is trial and error and some willingness to get your hands dirty and just try things out.
It's nice also if you have, like, a small project that you can work on, I think. Like, for example, my gas mileage Shiny app was how I taught myself Shiny because I needed a way to learn Shiny that was going to be fairly contained and simple. So I started with a small project that I was interested in that didn't have a huge amount of stakes behind it so that I could just focus on the learning.
Along those lines, are there kind of any technologies you've, like, learned recently that you think have had a really big payoff or, like, maybe have been really challenging to learn but you think were worthwhile?
That's a good question. At work lately, I've been using Ansible a lot to automate certain things. So our batch processing pipeline that I talked about gets, like, scheduled through an Ansible job. We've got an Ansible job to run certain reports. That's something that our DevOps person set up kind of for other purposes, and I was just like, oh, that seems cool. I'm going to, like, do you mind if I just, like, write some other jobs to do other things? And he's pretty chill, so he was like, yeah, go for it. So that has been a pretty interesting tool that I've been learning more about recently, yeah.
Advocating for R and hiring
Can you share any tips for educating, persuading people that you encounter who, like, don't see R as, like, a first-class language or as a real language?
Yes and no, I think. I think that my bigger tip is to try to ignore them as much as possible. Yeah, thank you. Because it is, it can be, and to a certain extent, if it's possible to block that out and do what you need to do, then it doesn't really matter what they think. But if they're the ones controlling what you can do at your organization, obviously that's a little bit tougher. And I think that that maybe gets back a little bit to what Elaine was talking about in her keynote yesterday, that if you can find a way to demonstrate some value early on, then maybe you can kind of reinforce and push to get greater acceptance once you've shown that R, in fact, can do all these things.
What's your experience when hiring new folks to how to, like, onboard them into this, like, mindset of, like, go from not being not just a data scientist but to learning a little bit about DevOps? Like, how do you do it? How do you find the people?
Oh, that's a great question. I haven't onboarded a lot of people to this way of working so far. But I guess I have a little bit. And I think that when you can demonstrate some of these tools that make it really easy, like, Test.NET makes it really easy to write tests. There are tools that exist that make this work, you know, not just a chore but something that is actually fairly easy to do. And so when you can demonstrate that and show how much time it can save, I think that that kind of can get people into understanding that this is a way of working that has longer-term benefits as well, yeah.
So I guess this is kind of a question for me. Like, as you've worked with, like, folks from other languages and, you know, doing their own kind of DevOps-y things, are there things that you, like, you see your colleagues using where you're like, oh, wow, I wish there was something like that in R?
I'm not thinking of anything. I mean, R has really good tools. Thanks, Adly. I'll see if I can think of something, but nothing's coming to mind. Yeah, thanks. I'll take that as a compliment.
Team structure at InsightRX
Any tips for pitching decision support models to senior business leaders who often prefer to use their experience slash gut feeling instead?
I do not have experience with that. For whatever reason, that's not been a challenge that we've run into at InsightRX, so I don't think that I can really speak to that one, unfortunately.
Okay, and I think we've got time for one last question. So what does your R data science team look like? Like, how many people are involved in building the package, doing modeling versus, like, product prototyping or testing?
Yeah, great question. InsightRX is a startup, so people wear lots of hats. We have now one, two, three. So I'm on a team of five. I am the only person with the title of data science engineer, and then we have a number of data scientists. And the breakdown can vary a lot, so it depends somewhat on what people are interested in, but typically I'm not involved in the modeling almost at all, and the data scientists will be. When it comes to developing prototypes, I think almost everyone has been involved in that, but depending on the project, it may not be everyone all at once. I am mostly the person responsible for maintaining the continuous integration pipelines, you know, maintaining our Docker build process, and developing new features within our API could be anyone on the team. I do it a fair amount, but other data scientists do as well.
Tags:Rstudio,Data Science,Machine Learning,Stats,Tidyverse,Data Visualization,Data Viz,Ggplot,Technology,Coding,Connect,Shiny,Rmarkdown,Package Manager,CRAN,Interoperability,Serious Data Science,Dplyr,Forcats,Ggplot2,Tibble,Readr,Stringr,Tidyr,Purrr,GitHub,Data Wrangling,Tidy Data,Odbc,Rayshader,Plumber,Blogdown,Gt,Lazy Evaluation,Tidymodels,Statistics,Debugging,Programming Education,Rstats,Open Source,Oss,Quarto,Posit,Python,ML